How to Calculate Profit Margin Percentage
Master the art of calculating profit margins with our comprehensive guide. Perfect for business owners, students, and finance professionals seeking to understand profitability metrics and make informed financial decisions.
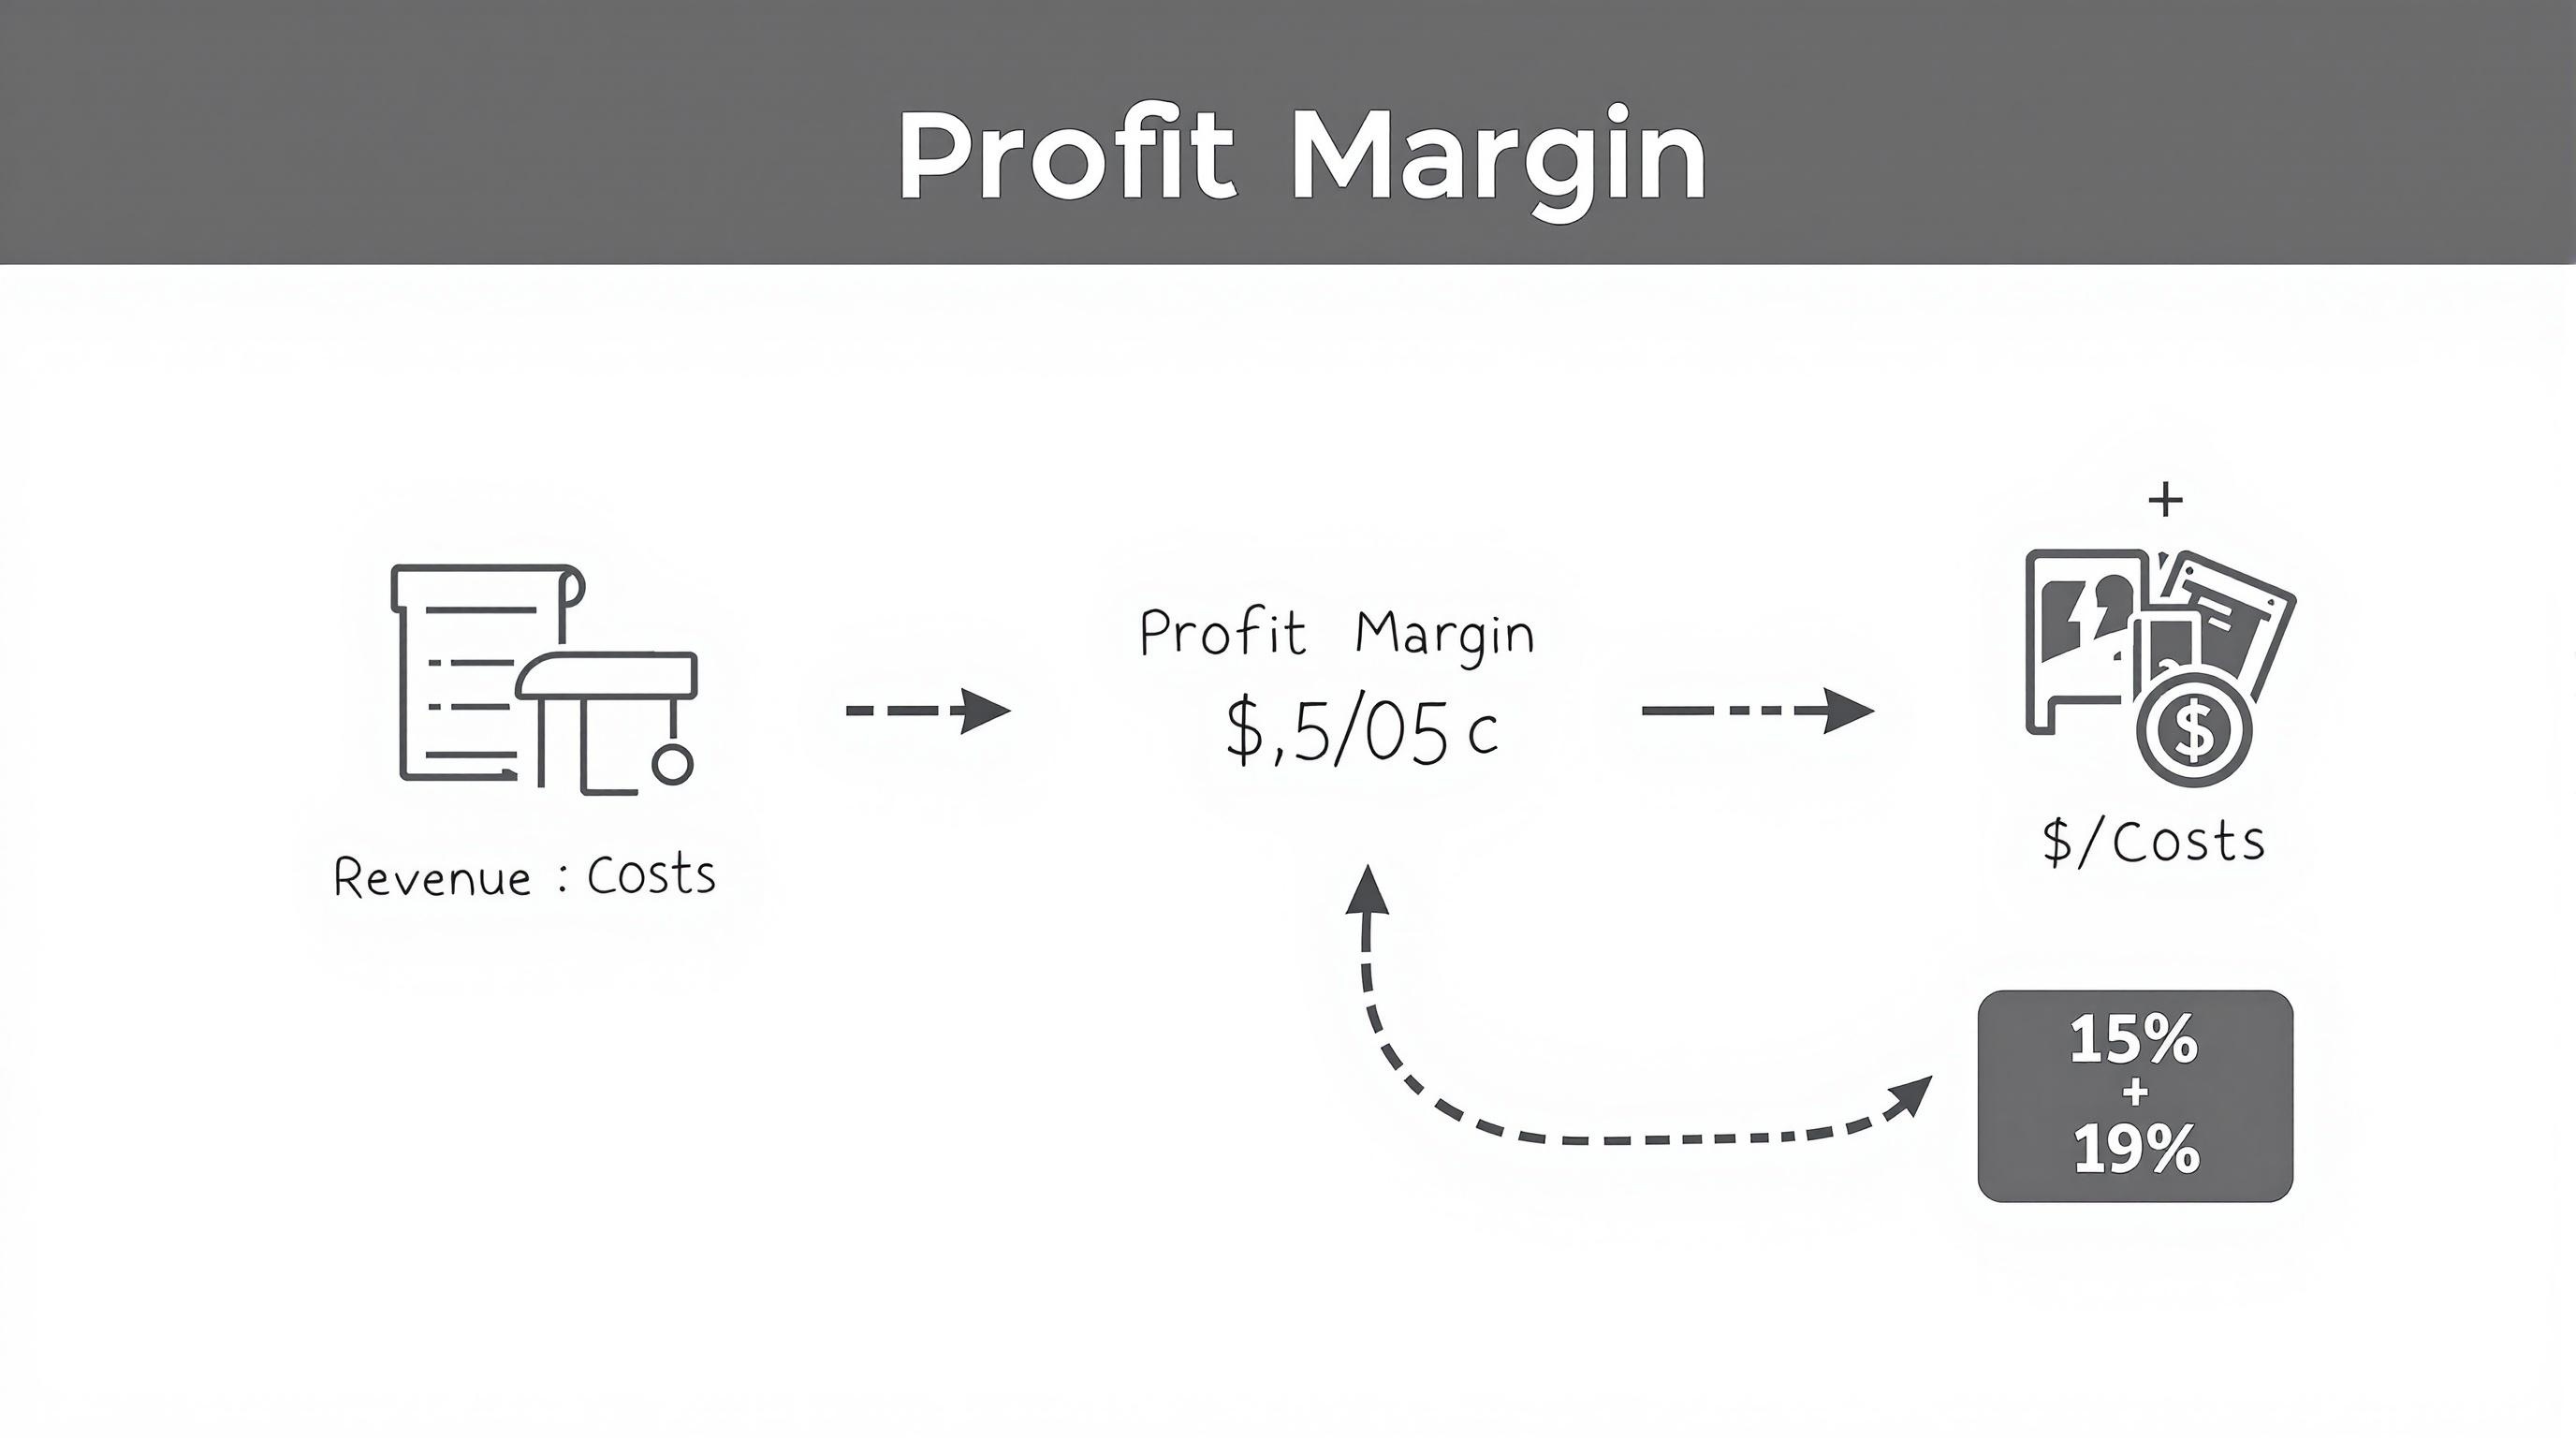
Table of Contents
Introduction to Profit Margin
Profit margin percentage is one of the most critical financial metrics used to evaluate business performance and profitability. It represents the percentage of revenue that remains as profit after accounting for various costs and expenses.
Understanding profit margins is essential for:
- Business owners making pricing decisions
- Investors evaluating investment opportunities
- Students learning financial analysis
- Engineers working on cost optimization projects
- Financial analysts comparing company performance
Types of Profit Margins
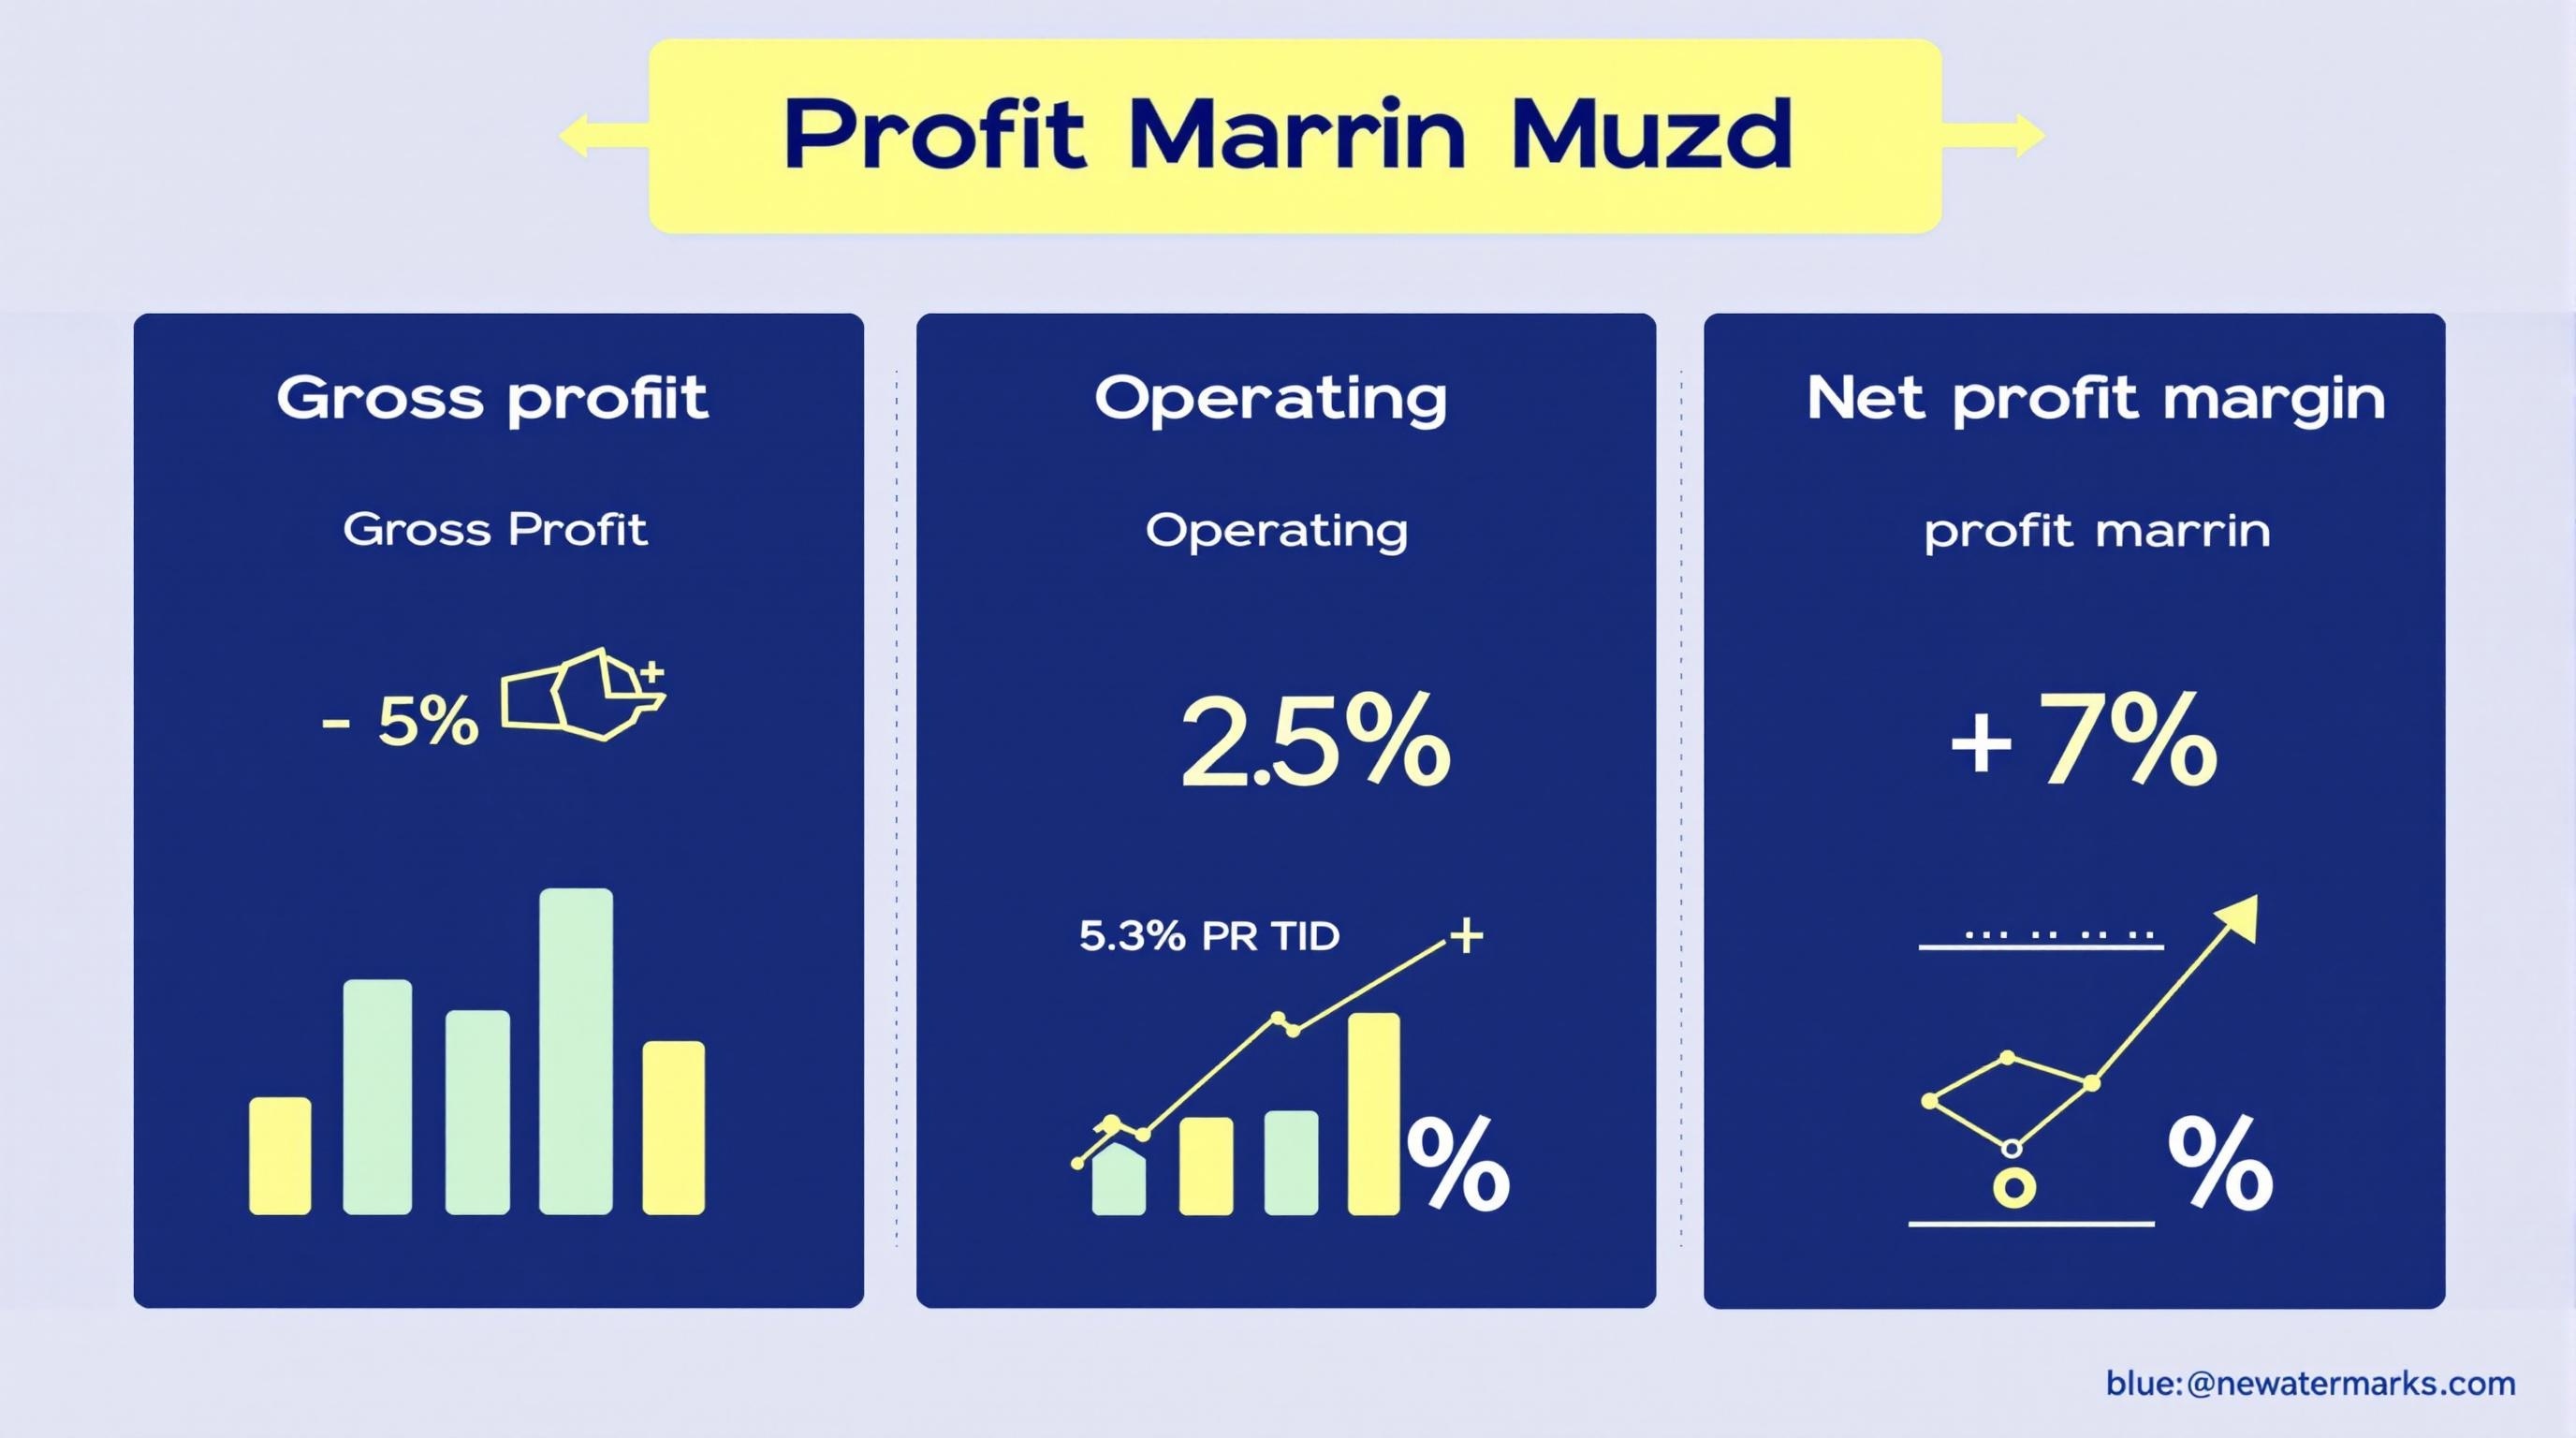
1. Gross Profit Margin
Formula: (Revenue - Cost of Goods Sold) ÷ Revenue × 100
Measures the percentage of revenue that exceeds the cost of goods sold, showing how efficiently a company produces its goods.
2. Operating Profit Margin
Formula: Operating Income ÷ Revenue × 100
Shows the percentage of revenue left after paying for variable costs and operating expenses, excluding interest and taxes.
3. Net Profit Margin
Formula: Net Income ÷ Revenue × 100
The most comprehensive measure, showing the percentage of revenue that remains as profit after all expenses, taxes, and interest.
Basic Profit Margin Formula
Universal Profit Margin Formula
Where:
- Profit: The amount of money remaining after expenses
- Revenue: Total income from sales or services
- Result: Percentage representing profit margin
Step-by-Step Calculation Examples
Example 1: Basic Profit Margin Calculation
Scenario: A company has $100,000 in revenue and $80,000 in total costs.
Step 1: Calculate Profit
Profit = Revenue - Total Costs = $100,000 - $80,000 = $20,000
Step 2: Apply the Formula
Profit Margin % = ($20,000 ÷ $100,000) × 100 = 20%
Result: The company has a 20% profit margin.
Example 2: Gross Profit Margin
Scenario: A retail store with $500,000 revenue and $300,000 cost of goods sold.
Step 1: Calculate Gross Profit
Gross Profit = Revenue - COGS = $500,000 - $300,000 = $200,000
Step 2: Apply the Formula
Gross Profit Margin % = ($200,000 ÷ $500,000) × 100 = 40%
Result: The store has a 40% gross profit margin.
Profit Margin Comparison Table
| Company | Revenue | Total Costs | Profit | Profit Margin % |
|---|---|---|---|---|
| Company A | $1,000,000 | $850,000 | $150,000 | 15% |
| Company B | $750,000 | $600,000 | $150,000 | 20% |
| Company C | $500,000 | $425,000 | $75,000 | 15% |
Practical Applications
For Business Owners
- Setting competitive pricing strategies
- Evaluating product profitability
- Making cost reduction decisions
- Planning business expansion
For Investors
- Comparing company performance
- Identifying investment opportunities
- Assessing financial health
- Making portfolio decisions
For Students
- Understanding financial concepts
- Completing business case studies
- Preparing for exams
- Analyzing company financials
For Engineers
- Cost optimization projects
- Process improvement initiatives
- Technology investment decisions
- Efficiency analysis
Industry Benchmarks
Understanding typical profit margins by industry helps contextualize your calculations:
| Industry | Typical Gross Margin | Typical Net Margin | Notes |
|---|---|---|---|
| Software/Technology | 70-85% | 15-25% | High margins due to scalability |
| Retail | 20-50% | 2-5% | Varies by product category |
| Manufacturing | 15-30% | 5-10% | Depends on production efficiency |
| Food Service | 60-70% | 3-5% | High labor and overhead costs |
| Healthcare | 50-80% | 10-18% | Regulated industry with steady demand |
Common Mistakes to Avoid
Mistake 1: Confusing Markup with Margin
Markup is the percentage added to cost, while margin is the percentage of the selling price.
Mistake 2: Using Incorrect Cost Figures
Ensure you're using the right type of costs (COGS for gross margin, total costs for net margin).
Mistake 3: Forgetting to Convert to Percentage
Always multiply by 100 to convert the decimal result to a percentage.
Mistake 4: Comparing Different Margin Types
Only compare like-for-like margins (gross with gross, net with net).
Tools and Calculators
Make your profit margin calculations easier with these recommended tools:
Business Calculators
Finance Calculators
Share This Guide
Found this guide helpful? Share it with others who might benefit from learning about profit margin calculations!
Frequently Asked Questions
What is a good profit margin percentage?
A good profit margin varies by industry. Generally, a net profit margin of 10-20% is considered healthy, but this can range from 5% in retail to 25% in technology companies.
How do you calculate profit margin in Excel?
In Excel, use the formula: =(Revenue-Costs)/Revenue*100. For example, if revenue is in cell A1 and costs in B1, the formula would be: =(A1-B1)/A1*100
What's the difference between profit margin and markup?
Profit margin is the percentage of the selling price that is profit, while markup is the percentage added to the cost price. For example, if you buy for $80 and sell for $100, the markup is 25% but the profit margin is 20%.
Can profit margin be negative?
Yes, profit margin can be negative if a company's costs exceed its revenue, indicating a loss. This is common for startups or companies during difficult periods.
How often should I calculate profit margins?
Most businesses calculate profit margins monthly or quarterly. However, for critical business decisions, you might need to calculate them more frequently or for specific products/services.
Conclusion
Understanding how to calculate profit margin percentage is essential for making informed business decisions, whether you're an entrepreneur, investor, student, or engineer. This comprehensive guide has provided you with the formulas, examples, and practical applications needed to master this crucial financial metric.
Remember to:
- Choose the right type of profit margin for your analysis
- Use accurate and consistent data
- Compare margins within the same industry
- Consider trends over time, not just single calculations
For quick and accurate calculations, bookmark our business calculators and explore our extensive collection of financial tools.
Next Steps
- Practice with your own business data
- Explore our finance calculators for more financial analysis
- Learn about related topics like ROI and break-even analysis
- Share this guide with colleagues and students